Austin Real Estate Sales Data Reveals a Significant Drop in February 2025
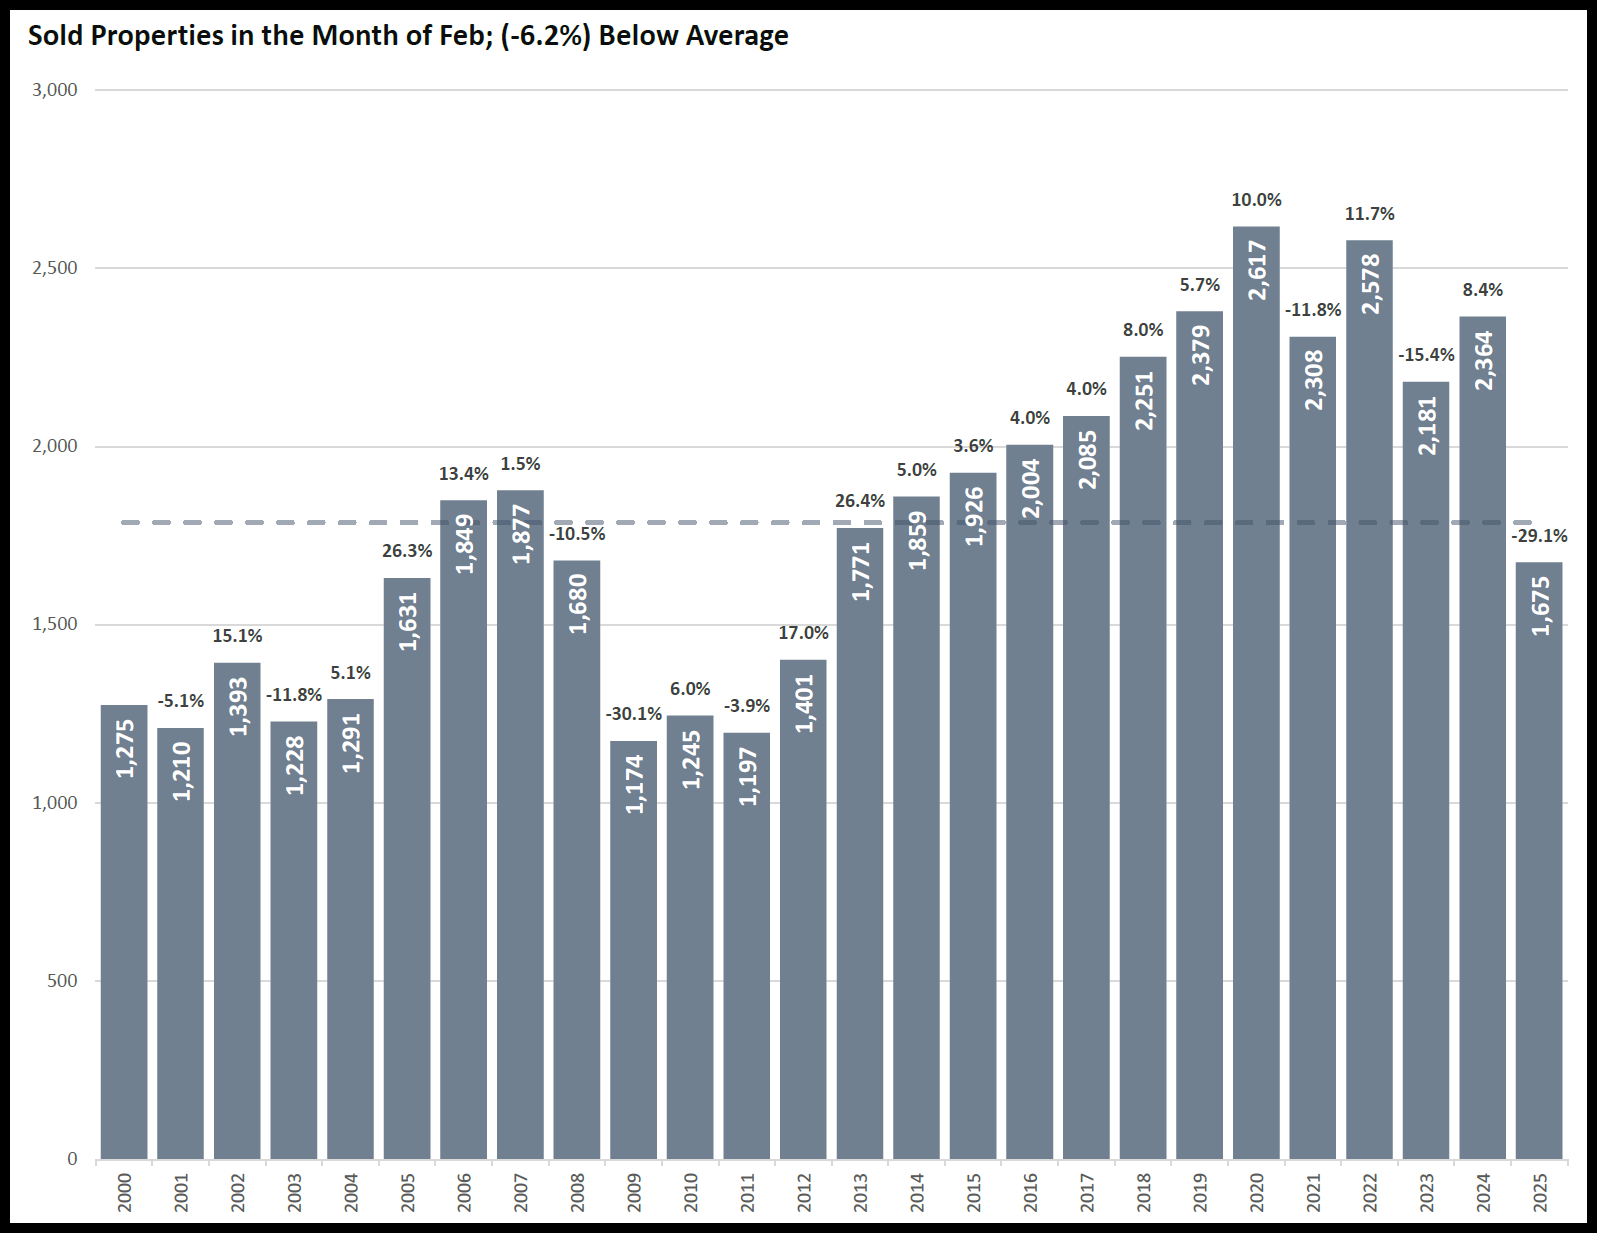
The Austin real estate market has always been a hot topic, especially in the six-county region that includes Travis, Williamson, Bastrop, Hays, Caldwell, and Burnet counties. Thanks to detailed data from Team Price Real Estate, revised on March 2, 2025, we can see exactly how many properties sold in February 2025 and how that compares to past years. The numbers tell a clear story: 1,675 properties were sold across this area in February 2025, a sharp decline from the 2,364 sold in February 2024. That’s a year-over-year decrease of 29.1%, one of the biggest drops in over two decades of records.
To understand this shift, let’s look at the historical data. Team Price Real Estate tracks sales back to 2000, showing an average of 1,787 properties sold each February across their market area. In 2025, the 1,675 sales figure falls 6.3% below that long-term average, which isn’t too surprising on its own. However, compared to February 2024’s stronger performance of 2,364 sales, the drop stands out. In fact, the data shows that the largest year-over-year February decline before this was 30.1%, from 1,680 in 2008 to 1,174 in 2009. This year’s 29.1% decrease is almost as dramatic, signaling a notable change in the market.
Breaking it down by county offers more insight into where these sales happened. In Travis County, which includes cities like Austin and Pflugerville, 778 properties sold in February 2025. Austin alone accounted for 610 of those sales, down from 765 the year before. Williamson County, home to Georgetown and Round Rock, saw 511 sales, with Georgetown dropping to 149 from 244 in 2024. Bastrop County recorded 82 sales across cities like Bastrop and Elgin, while Hays County, including Kyle and San Marcos, totaled 195 sales. Caldwell County had just 13 sales, with Lockhart falling to 9 from 37, and Burnet County logged 25 sales, with Burnet itself rising to 14 from 8. Adding these up gives us the 1,675 total, matching the Sales Density table from Team Price Real Estate.
The data also shows how sales per person and per real estate agent have shifted. In February 2025, the rate of sold properties per 100,000 population was 65.99, well below the historical February average of 95.2. Back in 2006, during a peak year, this rate hit 121.83, and even in 2024 it was 95.37. This year’s lower rate suggests fewer homes are selling relative to the area’s population, estimated at around 2.3 million for the Austin metro. Meanwhile, the number of Realtors per 100,000 people rose to 747 in February 2025, 7.5% above the average of 695. With more agents and fewer sales, the sales per 1,000 Realtors dropped to 88.31, a steep 50.4% below the average of 177.9.
Looking at monthly trends adds another layer. Historically, February sales increase by 18.7% over January, but in 2025, they fell 9.4% from January’s 1,848 to 1,675. This bucks the usual pattern, where spring brings a sales uptick. For example, in 2024, sales rose from 1,833 in January to 2,364 in February, a 29% jump. The 2025 decline aligns with a broader slowdown, as seen in the cumulative sales from January to February, which hit 6,000 properties—6.7% above the average but still reflecting a weaker February.
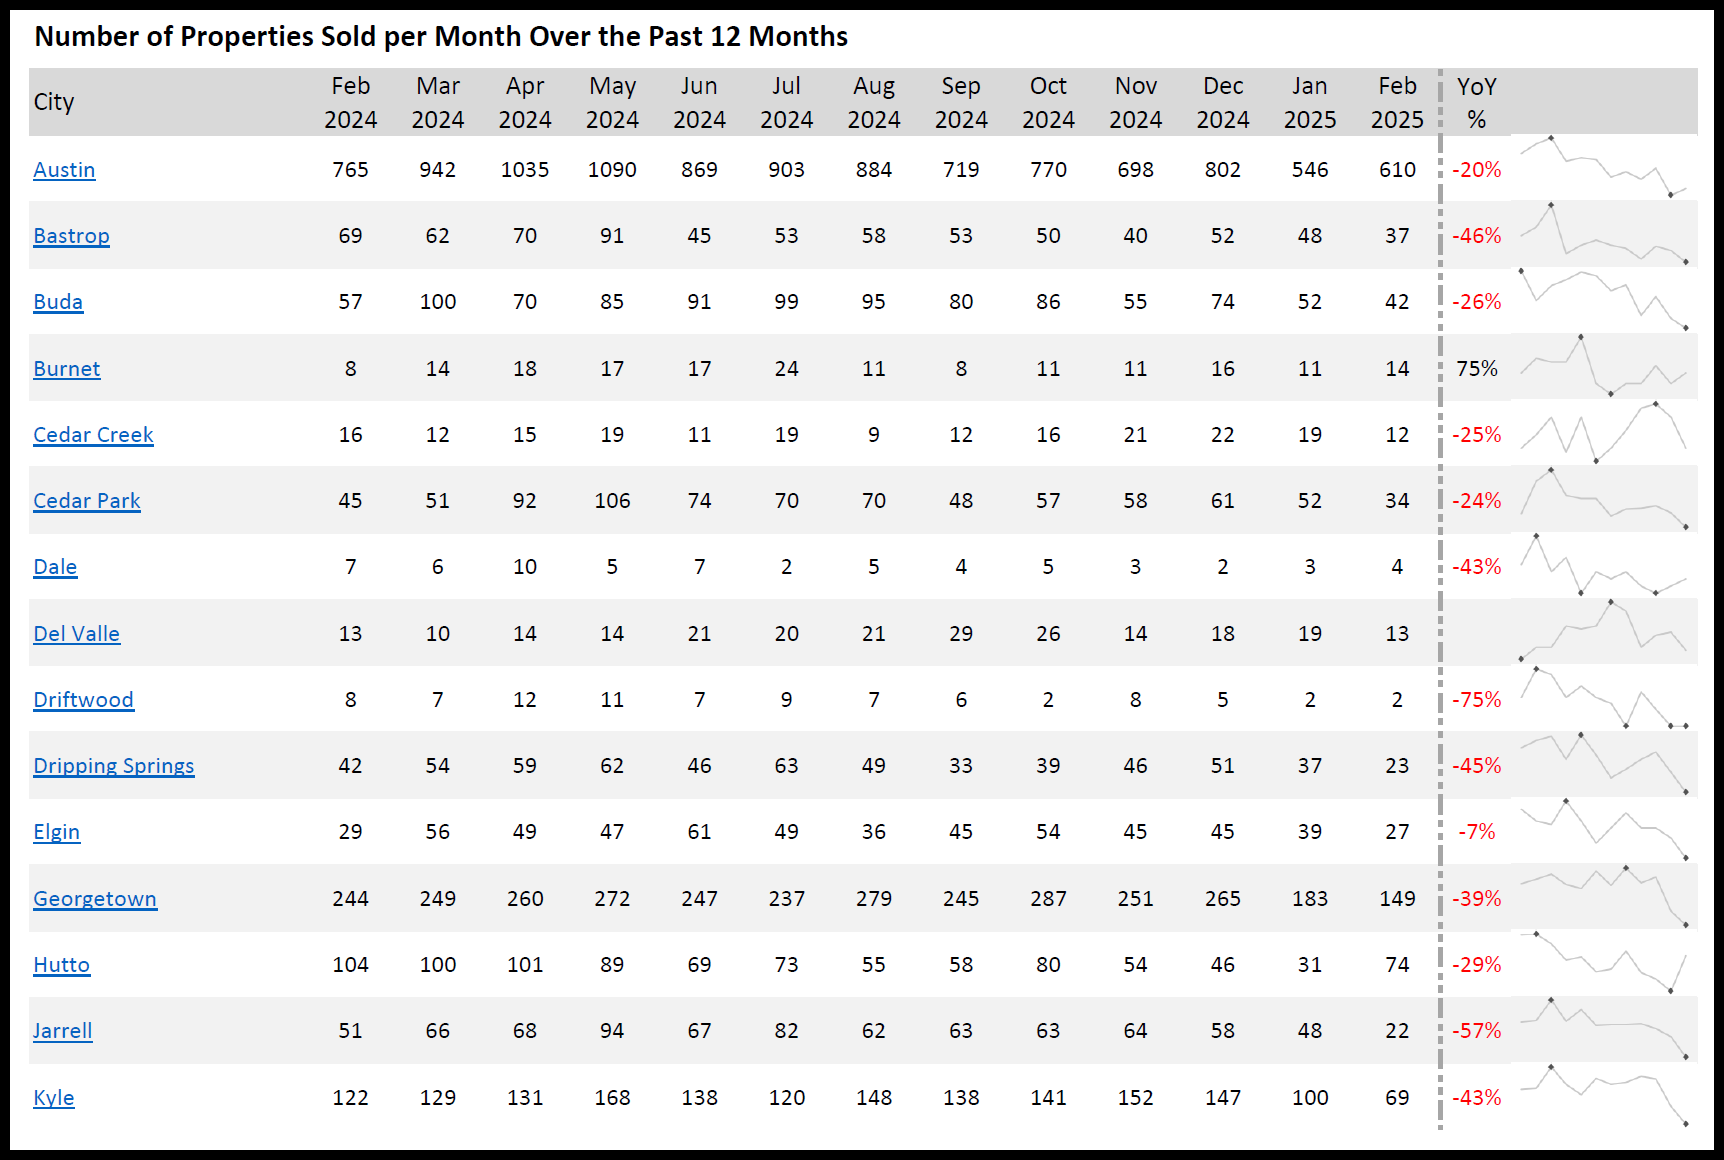
City-specific numbers highlight the uneven impact across the region. In Austin, sales fell 20% from 765 in February 2024 to 610 in 2025. Georgetown saw a 39% drop, from 244 to 149, while Bastrop plummeted 46%, from 69 to 37. Kyle’s sales decreased 43%, from 122 to 69, and Lockhart took a 76% hit, dropping from 37 to 9. On the flip side, Burnet bucked the trend with a 75% increase, from 8 to 14, though its small volume keeps it a minor outlier. Across 30 cities tracked over the past 12 months, the average year-over-year change was a 19% decline, but the six-county total’s 29.1% drop shows a deeper regional slump.
The data also includes ZIP code details, offering a granular view. For instance, in Austin’s 78704 ZIP code, sales fell from 34 to 29, a 15% dip, while 78723 saw a 38% decline from 40 to 25. In Georgetown’s 78628 ZIP, sales dropped 38% from 116 to 72. These figures, combined with the county totals, confirm the widespread nature of the slowdown. The Team Price Real Estate report notes this 29.1% year-over-year drop as one of the sharpest in its records, second only to the 2009 plunge during the Great Recession.
For real estate professionals, the numbers paint a challenging picture. With 747 Realtors per 100,000 people in February 2025, up from 796 in 2024, the agent pool grew while sales shrank. This pushed the sales per 1,000 Realtors down to 88.31 from a higher rate the previous year, when 2,364 sales spread across fewer agents yielded better productivity. Historically, peak years like 2006 saw 121.83 sales per 100,000 population and stronger per-agent numbers, contrasting sharply with 2025’s figures.
Wrapping up, the February 2025 data from Team Price Real Estate shows a six-county Austin area with 1,675 sold properties, down 29.1% from 2,364 in 2024. This drop, paired with lower sales per population and per Realtor, plus an unusual month-over-month decline, marks a significant shift in the market. Whether looking at the big picture or drilling into city and ZIP code specifics, the numbers reveal a region facing a tougher real estate landscape than it has in years.